Krishi Integrated Command and Control Centre (ICCC)
- 27 Mar 2024
Why is it in the News?
Earlier this month, Agriculture Minister Arjun Munda inaugurated a Krishi Integrated Command and Control Centre (ICCC) set up at Krishi Bhavan in New Delhi, a big-screen dashboard of all digital innovations in the sector.
What is the Krishi ICCC?
- The ICCC is a tech-based solution involving multiple IT applications and platforms, designed to help make informed decisions.
- The center is housed in the Ministry of Agriculture & Farmers’ Welfare and is responsible for legislation, policy formation, and implementation of initiatives in the agriculture sector.
- The ICCC uses state-of-the-art technologies such as artificial intelligence, remote sensing, and Geographic Information Systems (GIS) to collect and process large amounts of granular data.
- The ICCC uses platforms including the Krishi Decision Support System (DSS) to collect micro-level data, process it, and present the macro picture.
How does the Krishi ICCC Operate?
- Using AI and machine learning, the system will initially identify a farmer either through their mobile number or Aadhaar details.
- Next, it will cross-reference this information with the farmer's field data retrieved from land records, as well as historical crop sowing data from the crop registry, and weather information from IMD, among other sources.
- Subsequently, the system will generate personalized advisories tailored to the farmer's needs, presented in their local language.
- This functionality will be facilitated through the Bhashini platform, enabling translations into multiple Indian languages.
What Information Does the Krishi ICCC Offer?
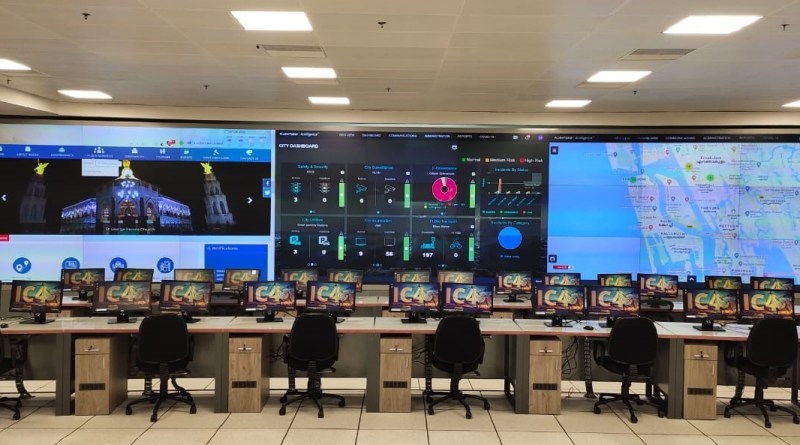
- Displayed on eight expansive 55-inch LED screens within the ICCC, the system provides comprehensive data covering various aspects such as temperatures, rainfall, wind speed, crop yields, production statistics, drought conditions, cropping patterns (both geographically and over time), and production forecasts.
- This information is presented in a graphical, map-based, timeline, and drill-down formats for enhanced visualization and analysis.
- Additionally, users can access pertinent trends, including periodic and non-periodic variations, outliers, and Key Performance Indicators (KPIs), alongside receiving insights, alerts, and feedback concerning agriculture schemes, programs, projects, and initiatives.
- Moreover, the system facilitates direct interaction between farmer beneficiaries and officials or the Minister through video conferencing facilities, ensuring effective communication and support.
Practical Applications:
- Farmer’s Advisory: The ICCC allows visualization of GIS-based soil carbon mapping as well as soil health card data for a particular district together in one place.
- This, when visualized with weather-related data from IMD for the selected district, will allow a customized and authentic advisory to be sent to the farmer about the type of crops that can be grown, and water and fertilizer requirements.
- Drought Actions: An increase or decrease in yield from a specific region (as per GCES data) can be correlated with weather, rainfall, and other information visualized through the Drought Portal, enabling the administration to understand the reason for the increase/ decrease in yield and to take decisions proactively.
- Crop Diversification: An analysis of crop diversification maps, together with field variability for paddy, will enable decision-makers to identify regions with scope for diversified cropping so that farmers can be advised accordingly.
- Farm Data Depository: Krishi Decision Support System (K-DSS), a platform under development, will act as an agriculture data repository. Integrated spatial and non-spatial data will be superimposed as a layer on the GIS map, and various AI/ ML models will be run on the data.
- The K-DSS will help in evidence-based, efficient, and data-driven decision-making, and assist in preparing customized advisories for farmers.
- Validation of Yield: Yield, as captured through Krishi MApper, can be analyzed with the yield generated through GCES application for a plot.