Consumption-Based Poverty Estimates (The Hindu)
- 17 Aug 2023
Why in the News?
- In a recent assessment of multidimensional poverty conducted by NITI Aayog, the findings reveal a decline in the poverty rate from 25% in 2015-16 to 15% in 2019-21.
- Notably, approximately 135 million individuals were elevated from impoverished conditions within this timeframe.
- Consequently, it becomes imperative to scrutinize the methodologies underpinning the multidimensional poverty index and ascertain the continued pertinence of poverty evaluations based solely on consumption.
What is Multidimensional Poverty?
- Traditionally, poverty has been predominantly gauged through single-dimensional indicators, frequently revolving around income levels.
- Multidimensional poverty, in contrast, comprehensively addresses the array of deficiencies that individuals grappling with poverty encounter in their daily existence.
- These deficiencies encompass compromised health, limited access to education, insufficient living conditions, disempowerment, subpar employment situations, exposure to violence, and inhabiting environmentally precarious regions, among other factors.
Distinguishing Between Consumption-Based and Multidimensional Poverty Indices (MPI):
- Poverty gauges based on consumption levels primarily address one aspect of deprivation, without accounting for other dimensions.
- The global MPI encapsulates both the extent of multidimensional poverty (the percentage of individuals within a population grappling with multidimensional poverty) and its depth (the average number of deprivations experienced by each impoverished individual).
- Nonetheless, it's important to recognize that while Multidimensional poverty estimates offer valuable insights, they are not intended to replace the National Sample Survey (NSS) consumption-based poverty ratios.
Recent Findings on Multidimensional Poverty in India:
- Within a mere 15-year span, from 2005/2006 to 2019/2021, a striking 415 million individuals in India have successfully transcended poverty, showcasing a commendable accomplishment by the world's most populous nation.
- These revelations stem from the latest global release of the Multidimensional Poverty Index (MPI) by the United Nations Development Programme (UNDP) and the Oxford Poverty and Human Development Initiative (OPHI) based at the University of Oxford.
- The global MPI stands as a comprehensive measure of poverty, encapsulating the various deprivations that underprivileged individuals encounter in the realms of education, health, and living conditions.
- In the year 2005/2006, approximately 645 million people grappled with multidimensional poverty in India; this figure dwindled to around 370 million in 2015/2016 and further down to 230 million in 2019/2021.
Challenges Associated with the Multidimensional Poverty Index:
- The Global MPI's Findings Are Not a Novel Revelation
- The application of the Global MPI as a conclusive breakthrough isn't unprecedented.
- Poverty estimations grounded in consumer spending and utilizing the Tendulkar committee's framework revealed a reduction of 137 million individuals living in poverty between 2004-05 and 2011-12, despite population growth.
- Following the Rangarajan Committee's methodology, the decrease from 2009-10 to 2011-12 stands at 92 million, equating to an annual reduction of 46 million.
- Myriad Indicators to Consider
- Given the extensive array of dimensions and indicators, it becomes imperative to engage in meticulous asset mapping to pinpoint the most pertinent parameters.
- However, owing to the abundance of indicators spanning multiple dimensions, the accurate evaluation, and consequent effective policy implementation might pose challenges.
- Aggregating Across Indicators
- This presents yet another predicament, as these indicators should ideally remain independent of each other.
- For instance, indicators like access to clean drinking water should not be aggregated with factors such as child mortality."
Challenges Regarding Consumption Expenditure Surveys:
- After 2011-12, there is a lack of accessible official records on consumer expenditure, which inhibits the capacity to juxtapose it with trends in the multidimensional poverty index.
- The survey outcomes about consumption expenditures from 2017-18 have not been officially disseminated.
- Given the dearth of this information, various studies have attempted to investigate poverty utilizing indirect techniques along with resources such as the Centre for Monitoring Indian Economy (CMIE) and the Periodic Labour Force Survey (PLFS). These endeavors, however, have yielded disparate findings.
Approaches to Tackle MPI Challenges:
- Integration of MPI with Consumption-Based Poverty Assessments
- Examining the advancements in non-monetary aspects like education, healthcare, sanitation, access to clean water, and child survival alongside income or consumption poverty can provide valuable insights.
- However, the conversion of all these variables into a single index introduces complexities.
- Incorporating Public Services as an Additional Dimension: Regarding multidimensional matters, considering public services as an independent dimension, beyond consumption, can yield more comprehensive results.
Reforming Consumption Expenditure Surveys: A Necessity
- Enhancing Data Collection Practices
- An imperative concern revolves around the disparities observed in aggregate consumption estimations between National Accounts Statistics (NAS) and National Sample Survey (NSS) data.
- It's worth noting that across all nations, the NSS and NAS consumption estimates invariably diverge – a trend India also follows.
- What is particularly perplexing is the escalating dissimilarity in India between NSS and NAS consumption figures over the years.
- From a divergence of under 10% in the late 1970s, this gap has widened to a substantial 53.1% in 2011-12. This disparity is too significant to disregard.
- The National Statistical Office ought to meticulously analyze this issue and proffer potential solutions to enhance data collection through both avenues.
- Moreover, it's essential to complement the outcomes of consumption surveys with an evaluation of the impact of public expenditure on the health and education of distinct expenditure strata.
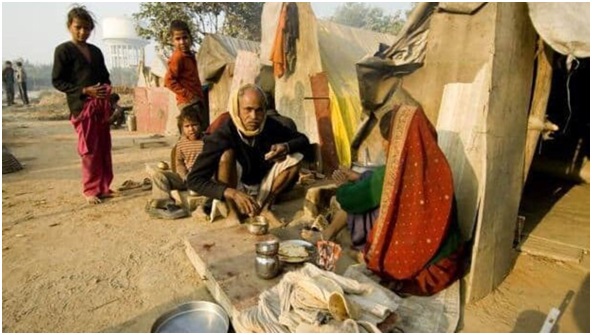
A prevalent perception associates wealth or destitution with high or low-income levels. The insufficiency of income is mirrored in numerous non-income poverty indicators.
Defining poverty in terms of income, or when income data is lacking, in terms of expenditure, appears to be the most pertinent approach, and this methodology is prevalent across the majority of countries.